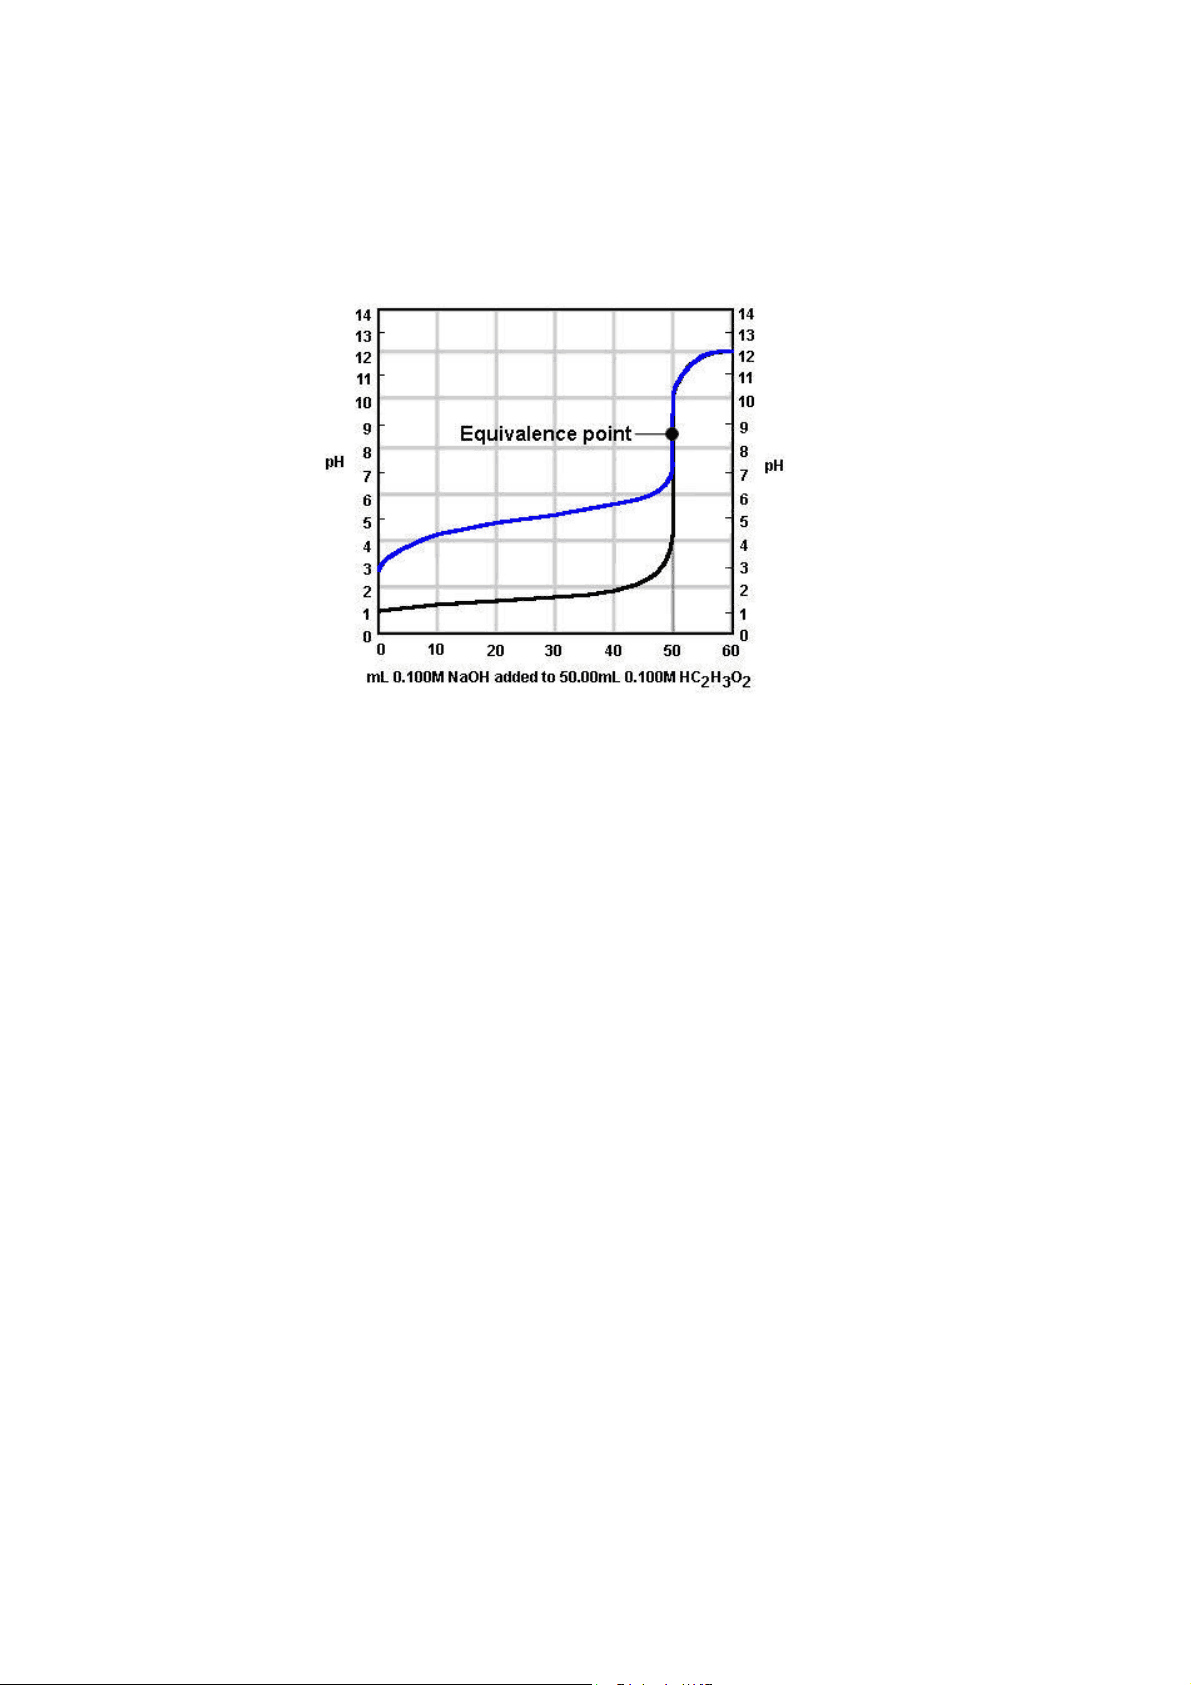
Docsity
Docsity

Prepare for your exams

Study with the several resources on Docsity


Earn points to download

Earn points by helping other students or get them with a premium plan


Guidelines and tips
Guidelines and tips

weak acid strong base titration curve, Schemes and Mind Maps of Chemistry

Great schemes about weak acid strong base titration curve

Typology: Schemes and Mind Maps

2018/2019

Uploaded on 07/31/2019

judyth
judyth 🇺🇸

4.6

(27)

321 documents

1 / 6

Toggle sidebar

This page cannot be seen from the preview

Don't miss anything!

bg1
TitrationCurves
9
Here,0.100MNaOHisbeingaddedto50.0mLof0.100M
aceticacid.
Therearethreemajordifferencesbetweenthiscurve(inblue)and
theonewesawbefore(inblack):
1.TheweakacidsolutionhasahigherinitialpH.
2.ThepHrisesmorerapidlyatthestart,butlessrapidlynearthe
equivalencepoint.
3.ThepHattheequivalencepointdoesnotequal7.00.
POINTOFEMPHASIS:
Theequivalencepointforaweak
acidstrongbasetitrationhasapH>7.00.
Forastrongacidweakbaseorweakacidstrongbasetitration,
thepHwillchangerapidlyattheverybeginningandthenhave
agradualslopeuntilneartheequivalencepoint.Thegradual
sloperesultsfromabuffersolutionbeingproducedbythe
additionofthestrongacidorbase,whichresistsrapidchange
inpHuntiltheaddedacidorbaseexceedsthebuffer'scapacity
andtherapidpHchangeoccursneartheequivalencepoint.
TitrationsInvolvingaWeakAcidorWeakBase
Titrationcurveofaweakacidbeingtitratedbyastrongbase:
pf3
pf4
pf5

Partial preview of the text

Download weak acid strong base titration curve and more Schemes and Mind Maps Chemistry in PDF only on Docsity!

Here, 0.100 M NaOH is being added to 50.0 mL of 0.100 M acetic acid. There are three major differences between this curve (in blue) and the one we saw before (in black):

  1. The weakacid solution has a higher initial pH.
  2. The pH rises more rapidly at the start, but less rapidly near the equivalence point.
  3. The pH at the equivalence point does not equal 7.00. POINT OF EMPHASIS : The equivalence point for a weak acidstrong base titration has a pH > 7.00. For a strong acidweak base or weak acidstrong base titration, the pH will change rapidly at the very beginning and then have a gradual slope until near the equivalence point. The gradual slope results from a buffer solution being produced by the addition of the strong acid or base, which resists rapid change in pH until the added acid or base exceeds the buffer's capacity and the rapid pH change occurs near the equivalence point.

Titrations Involving a Weak Acid or Weak Base

Titration curve of a weak acid being titrated by a strong base:

EXAMPLE: What is the pH when 30.0 mL of 0.100 M NaOH have been added to 50.0 mL of 0.100 M acetic acid? STEP 1: Stochiometric calculation: The original number of moles of HC 2 H 3 O 2 in the solution is : 50.0 x 10 3 L x 0.100 M = 5.00 x 10 3 moles HC 2 H 3 O 2 Similarly, there are 3.00 x 10 3 moles of OH due to the NaOH solution. The reaction goes to completion: OH (aq) + HC 2 H 3 O 2 (aq) > C 2 H 3 O 2 (aq) + H 2 O (l) The total volume is 80.0 mL. We now calculate the resulting molarities : [HC 2 H 3 O 2 ] = { 2.00 x 10 3 mol HC 2 H 3 O 2 / 0.0800 L } = 0.0250 M [C 2 H 3 O 2 ] = { 3.00 x 10 3 mol C 2 H 3 O 2 } / 0.0800 L } = 0.0375 M STEP 2: Equilibrium calculation, using simplification: Ka = { [H

][C 2 H 3 O 2 ] / [HC 2 H 3 O 2 ] } = 1.8 x 10 5 [H

] = { KA [HC 2 H 3 O 2 ] / [C 2 H 3 O 2 ] } = { (1.8 x 10 5 )(0.0250) / (0.0375) } = 1.2 x 10 5 M pH = log(1.2 x 10 5 ) = 4.

Titrations of Polyprotic Acids An example of a polyprotic acid is H 2 CO 3 which neutralizes in two steps: H 2 CO 3 (aq) + OH (aq) H 2 O (l) + HCO 3 (aq) HCO 3 (aq) + OH (aq) H 2 O (l) + CO 3 2 (aq) The titration curve for these reactions will look like this, with two equivalence points.

Uses of Titration Curves Use titration data or a titration curve to calculate reaction quantities such as the concentration of the substance being titrated. The most common use of titrations is for measuring unknown concentrations. This is done by titrating a known volume of the unknown solution with a solution of known concentration (where the two react in a predictable manner) and finding the volume of titrant needed to reach the equivalence point using some method appropriate to the particular reaction. Then, the volume and concentration of titrant can be used to calculate the moles of titrant added, which, when used with the reaction stoichiometry, gives the number of moles of substance being titrated. Finally, this quantity, along with the volume of substance being titrated, gives the unknown concentration. For acidbase titrations, the equivalence point can be found very easily. A pH meter is simply placed in the solution being titrated and the pH is measured after various volumes of titrant have been added to produce a titration curve. The equivalence point can then be read off the curve.